Official open data · maps · time series
What housing costs, region by region
Interactive maps of sale prices, computed from the open data of statistics offices, land registries and tax administrations. The map shows where we already have data – click a region to open it.
All countries
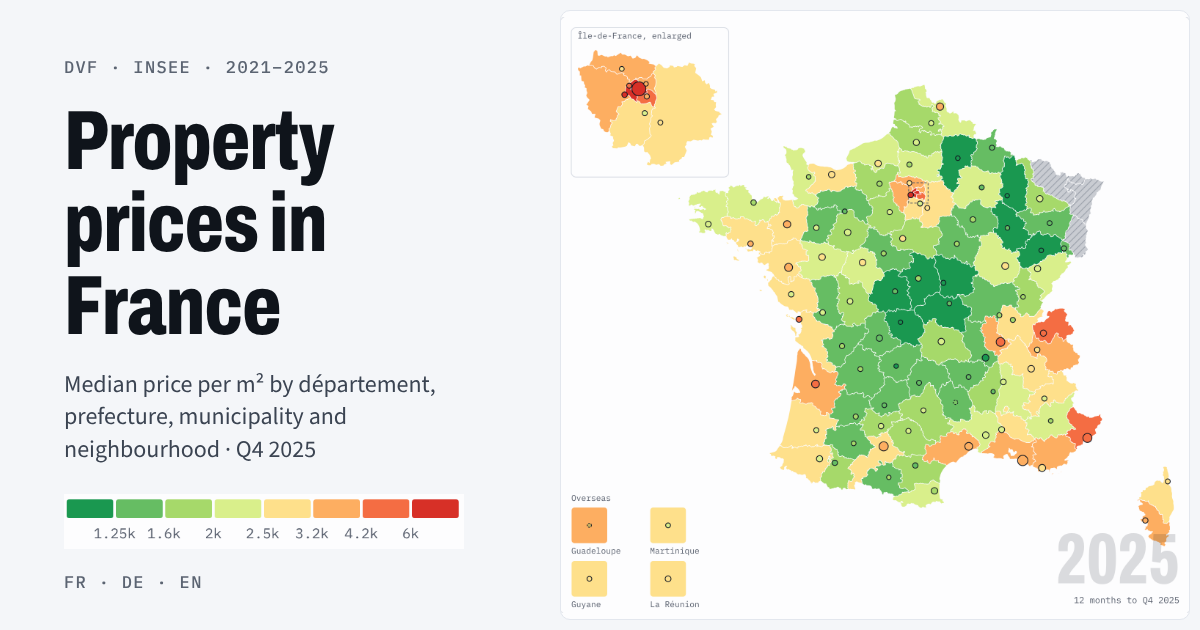 FranceMedian price per m² across all recorded sales of houses and flats.Sales 2021–2025 (DVF)101 départements, municipalities, IRIS neighbourhoodsReal and nominal, with confidence intervalOpen the map →
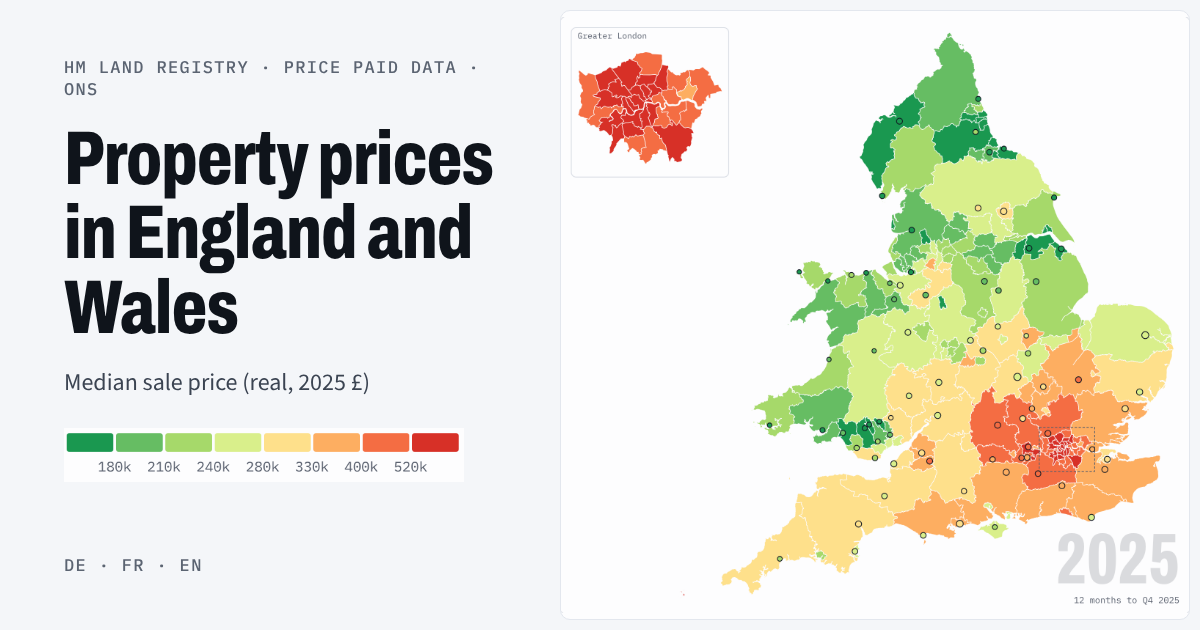 England and WalesMedian price per home across all sales registered with the Land Registry.Sales 2015–2025 (HM Land Registry)175 counties and unitary authorities, neighbourhoods (MSOA, LSOA)Houses and flats, with confidence intervalOpen the map →
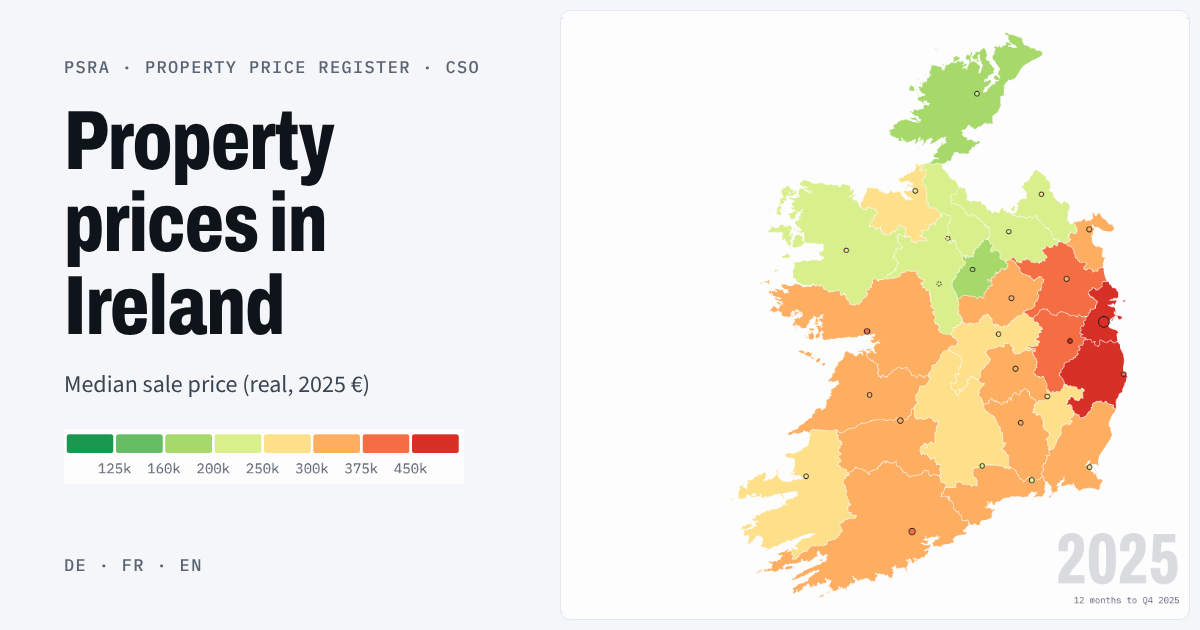 IrelandMedian price per home from the official register of all sales.Sales 2010–2025 (Property Price Register)26 counties, 163 local electoral areasNew and second-hand, with confidence intervalOpen the map →
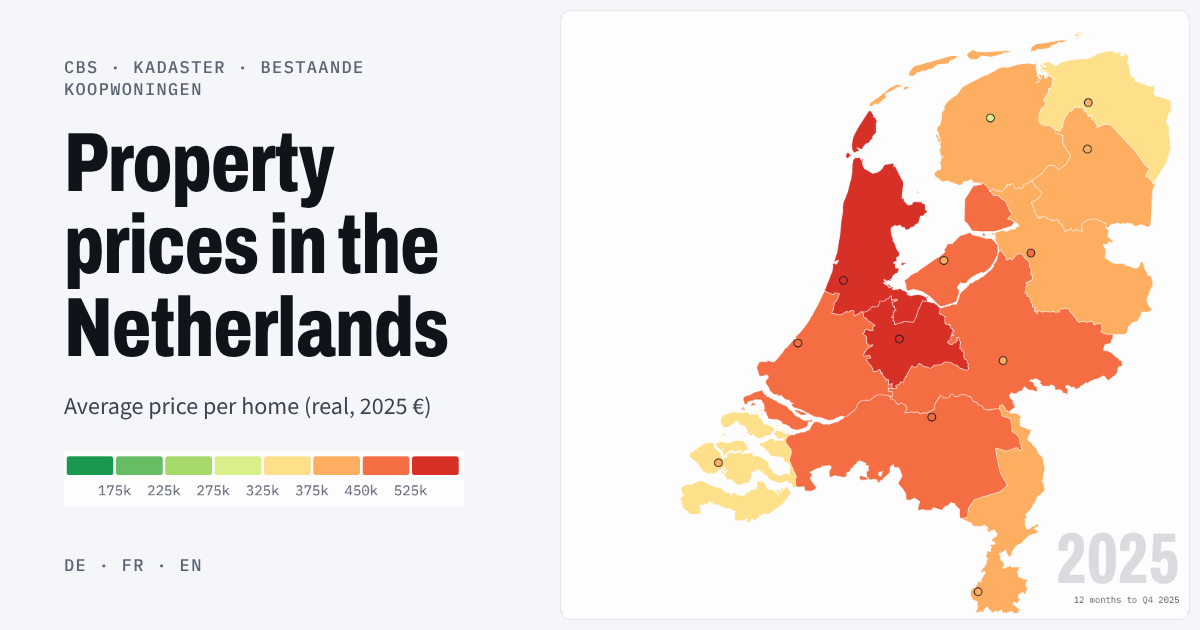 NetherlandsAverage sale price per home from the complete land register.Years 1995–2025 (CBS/Kadaster)12 provinces, 342 municipalitiesReal and nominal, price index since 1995Open the map →
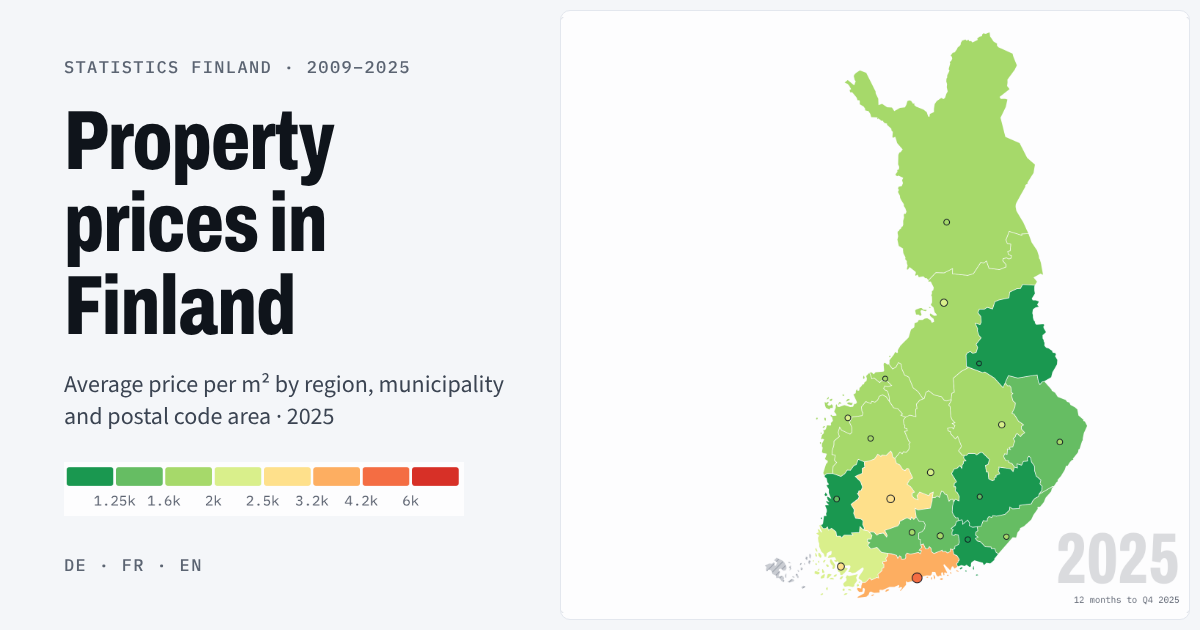 FinlandAverage price per m² of old flats and terraced houses in housing companies.Years 2009–2025 (Statistics Finland)18 regions, municipalities, postal code areasReal and nominal, price index since 1988Open the map →
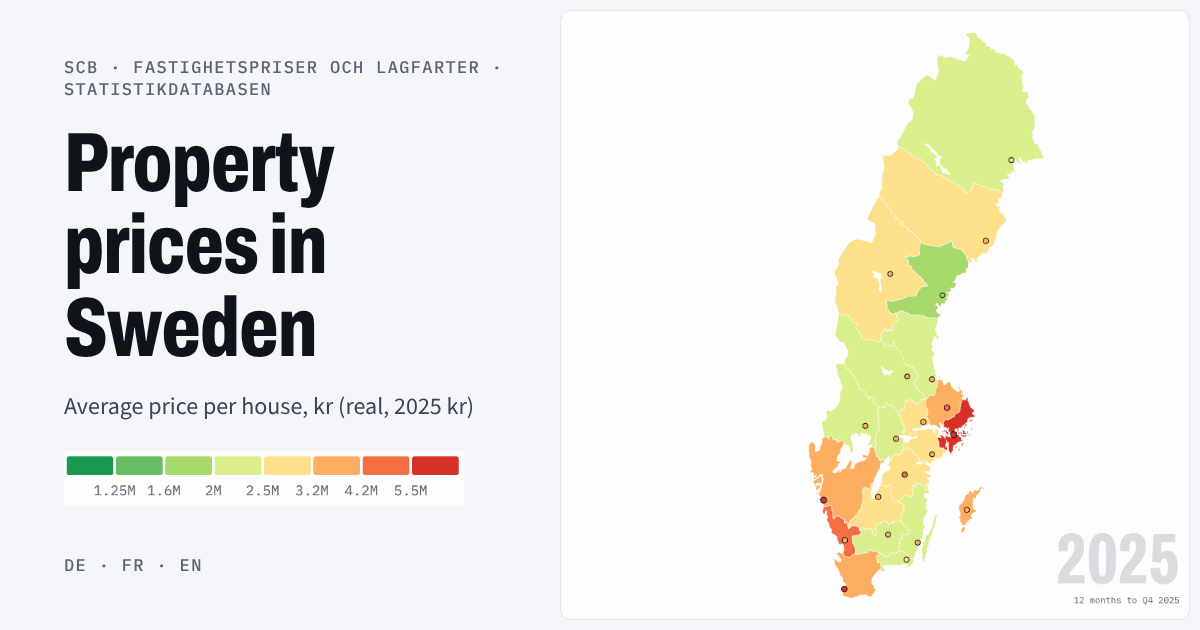 SwedenAverage purchase price per house (permanent and holiday homes; flats are not covered).Years 2009–2025 (SCB)21 counties (län), 290 municipalitiesReal and nominal, price index since 1986Open the map →
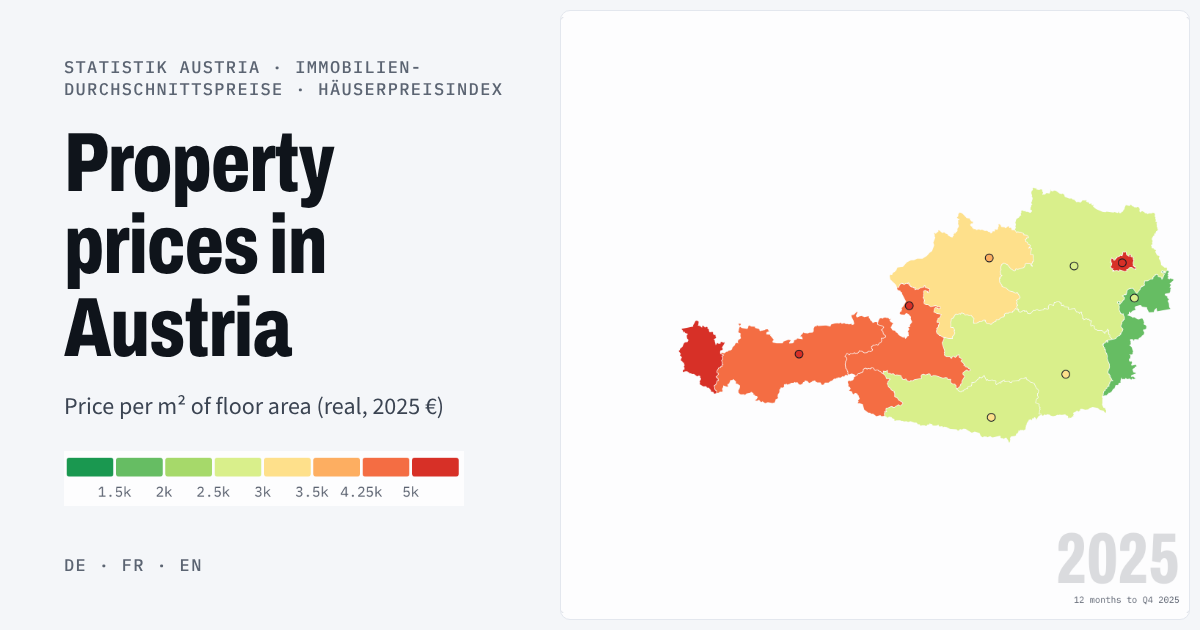 AustriaMedian price per m² of houses and flats bought by private households.Years 2015–2025 (Statistik Austria)9 states, 93 districts, 23 Vienna districtsReal and nominal, house price index since 2010Open the map →
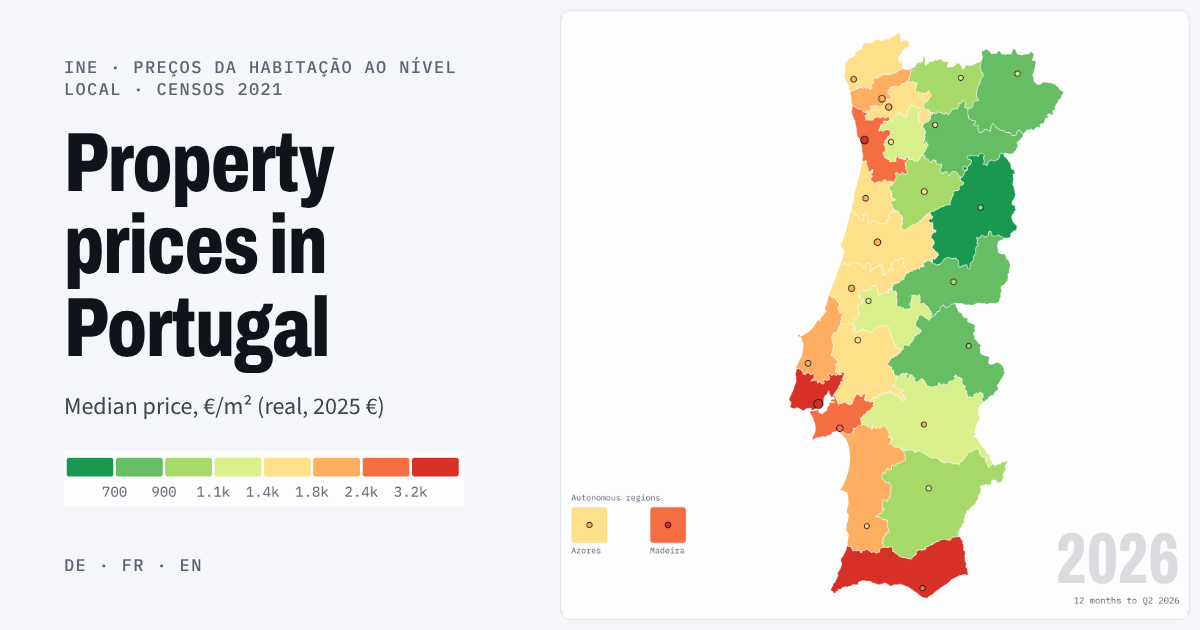 PortugalMedian price per m² of all dwellings sold, from tax records.Sales 2019–2026 (INE)26 regions, 308 municipalities, parishesReal and nominal, price index since 2009Open the map →
Countries publish their data differently: France, England and Wales and Ireland every single sale (hence medians), Finland, the Netherlands, Sweden, Austria and Portugal figures per area. Only France, Finland, Austria and Portugal have prices per m²; elsewhere the figures are prices per home or house. Values are therefore exactly comparable within a country, but only roughly between countries. Method and sources are on each country page.